The Simplest Trading Strategy for Beginners: The 3 Rules Setup (2)
Example 2: $UNH on the Monthly Chart (May 15, 2025)
In the first example, I showed you how the 3-rules setup works on a lower timeframe chart. Now, let’s take it a step further and look at how powerful this setup can be on higher timeframes like the weekly and monthly charts—especially when applied to large and mega-cap stocks.
The Setup: Buying the Dip on $UNH
We all know that UnitedHealth ($UNH) had a big scandal earlier this year, and the stock price has been dropping since then. But this is still one of the largest insurance companies in the U.S., so I see this as a good chance to buy the dip.
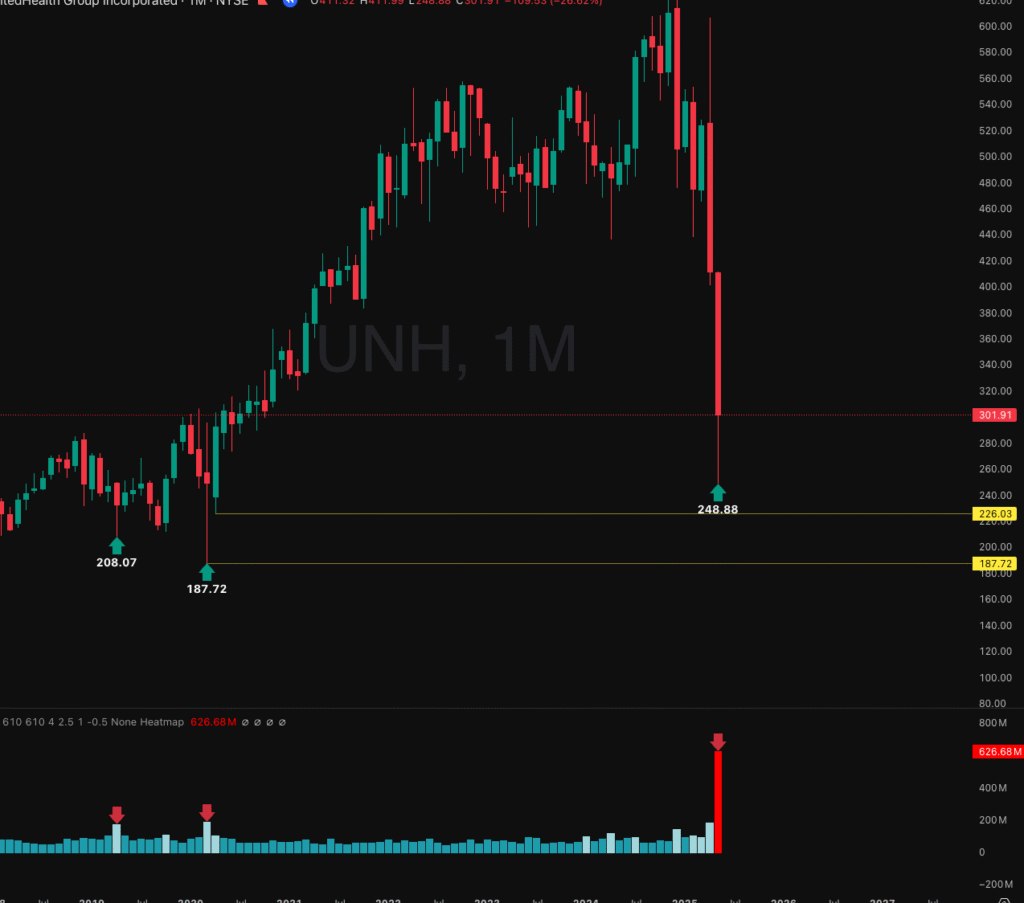
Figure 1: $UNH 1-Month chart with pivot levels $187 and $226.
In May 2025, the price was dropping sharply. I noticed a huge spike in volume—the highest since 1998—as the stock hit a major pivot zone from the 2020 uptrend, around $187–$226. By the end of the month, the candle closed with a large wick, which checked all 2 of the key rules in my system.
Also, the candle closed far above the low, leaving a long bottom wick. On the monthly chart, that’s a strong sign buyers stepped in to defend the pivot zone around $187–226. It didn’t close above a previous swing high, but it did recover a big part of the selloff. In my system, that still counts as confirmation when you combine it with the wick—though how strict you are with the “close rule” on higher timeframes is up to you.
Trade Trigger at $248.88
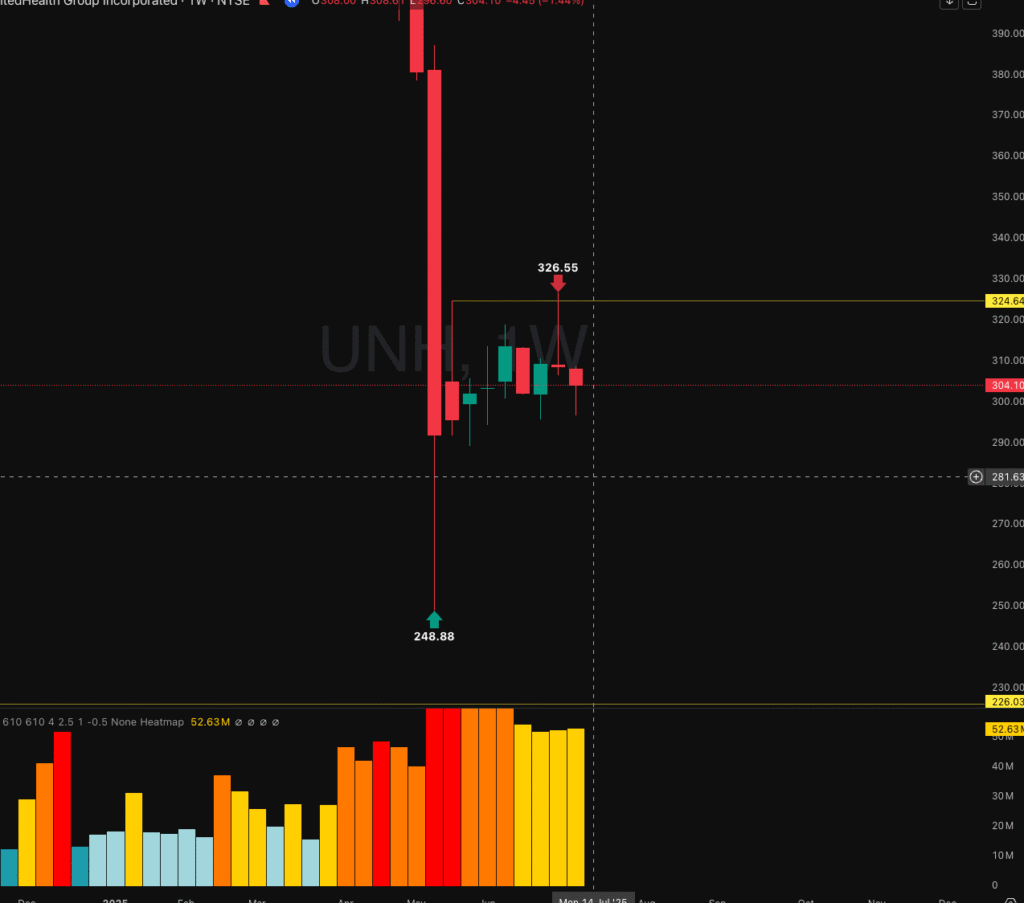
Now we already have our entry point, which is right at the bottom of the wick candle around $248.88. That level gives us a clear and logical place to enter because it marks where buyers stepped in with strength after heavy selling.
The next step is to figure out our target. As the stock begins to recover, it usually moves back toward the previous pivot high—the level where sellers last pushed price down before it came back to our entry. That becomes our most natural target because it’s the next area of resistance where we can expect another fight between buyers and sellers.
At this point, there’s nothing more to do except let the market play out. This is where discipline makes the difference. It’s easy to get impatient and jump in and out too early, but the market rewards those who can wait. By sticking to the plan—entry at $248.88—we give ourselves the best chance to catch a strong move.
Always remember: patience is the key in trading. Most of the time, the best trades come from waiting for the setup to fully develop instead of forcing it.
Zooming Into the Daily Chart (1D)
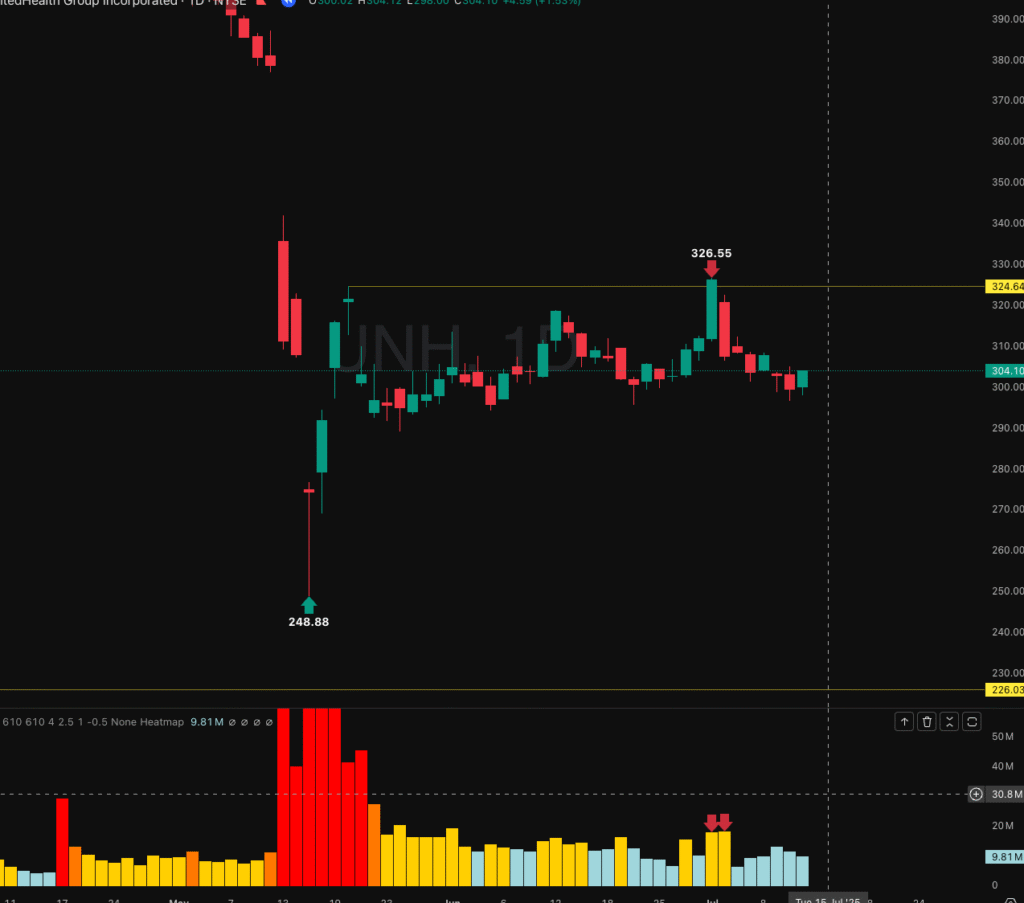
Now let’s move down to the daily timeframe (1D) for a closer look. As you can see, the market pushed up to around $324.64. On the second test of that level, we saw a clear spike in volume, which confirmed that sellers stepped back in and were ready to push the price back down toward our entry around $248.88.
For me, this is not a short setup. Shorting at these levels is very risky because the stock is already deep into a big selloff, and the risk-to-reward isn’t worth it. My focus here is on the long side, because the rule is simple: buy low and sell high. That’s how we put the odds in our favor.
In fact, about 90% of my trades are long setups. Shorting can work, but it’s a lot harder to time and manage compared to buying into strong support or pivot levels. I’ll save the details on short setups for another post, but for now just know my priority is always looking for quality buy opportunities at areas of pivot.
The Trade in Motion
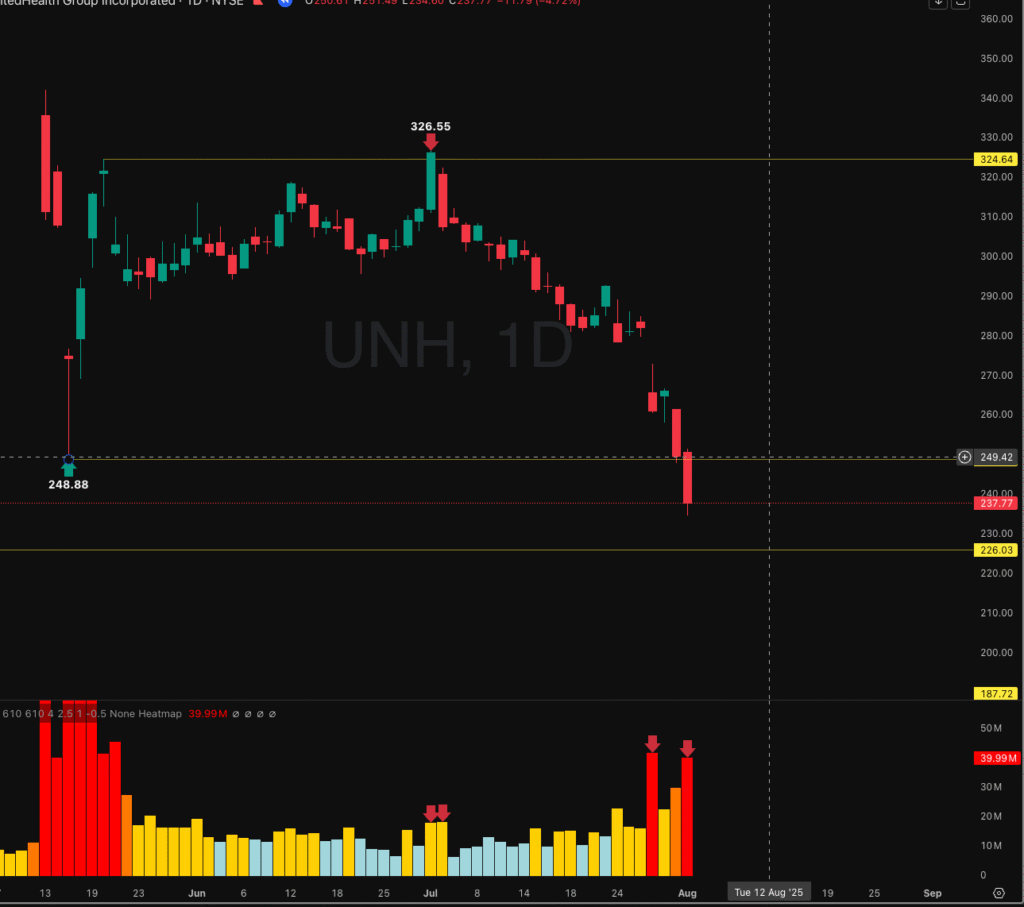
As price moved down toward $248.88, the volume kept rising sharply, and that gave me confidence to stay with the trade. However, the very next day Friday Aug 1st, 2025 the stock dropped another 4%, and I’ll be honest—it shook me a little.
This is exactly the moment where we need to talk about stop loss. No matter how strong a setup looks, the market can always go further than we expect. That’s why having a clear stop loss is critical—it protects us when the trade doesn’t work right away and keeps small losses from turning into big ones.
Defining the Stop-Loss
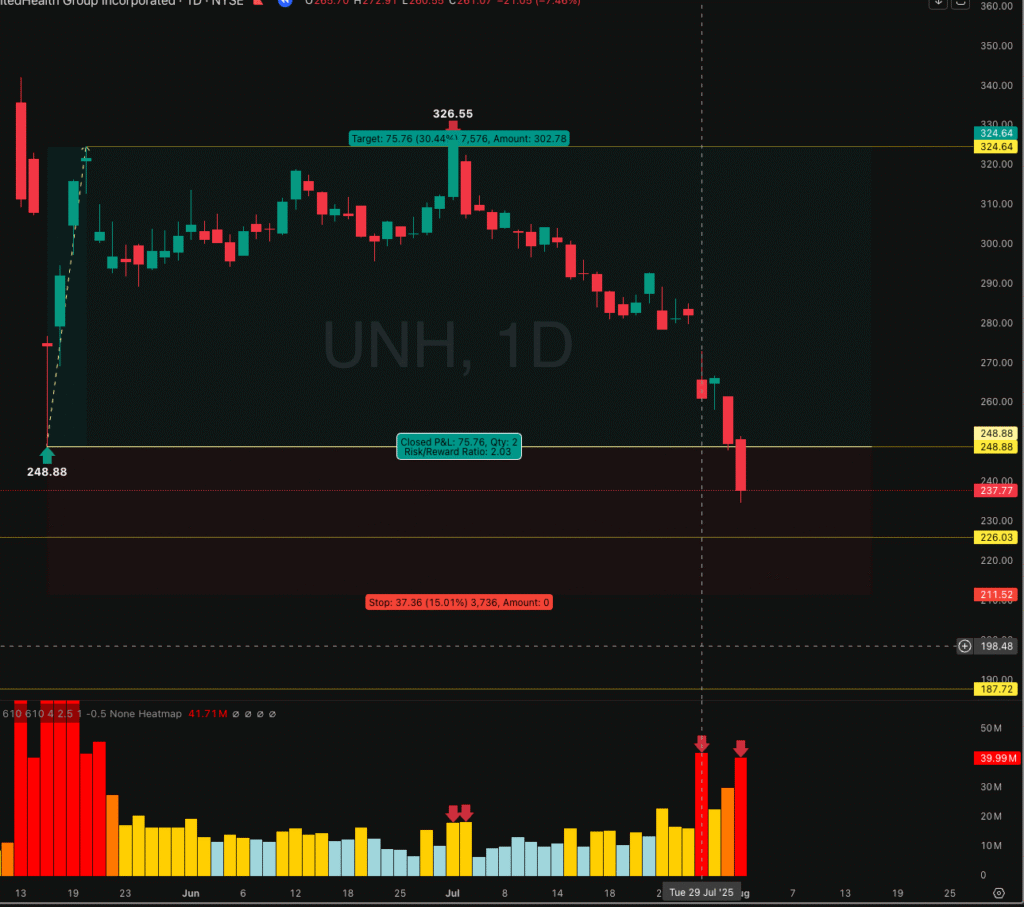
From our entry to the target, the trade gives about a 30% potential gain. I always aim for at least a 2:1 risk-to-reward (RR), so in this case that sets my stop at around 15% below entry, which is close to $211.
If the price falls below that level, I’m out. Simple as that. The point is to protect capital first—there’s always another trade, but we can’t get back money we lose by holding on too long.
The Exit: Following the System
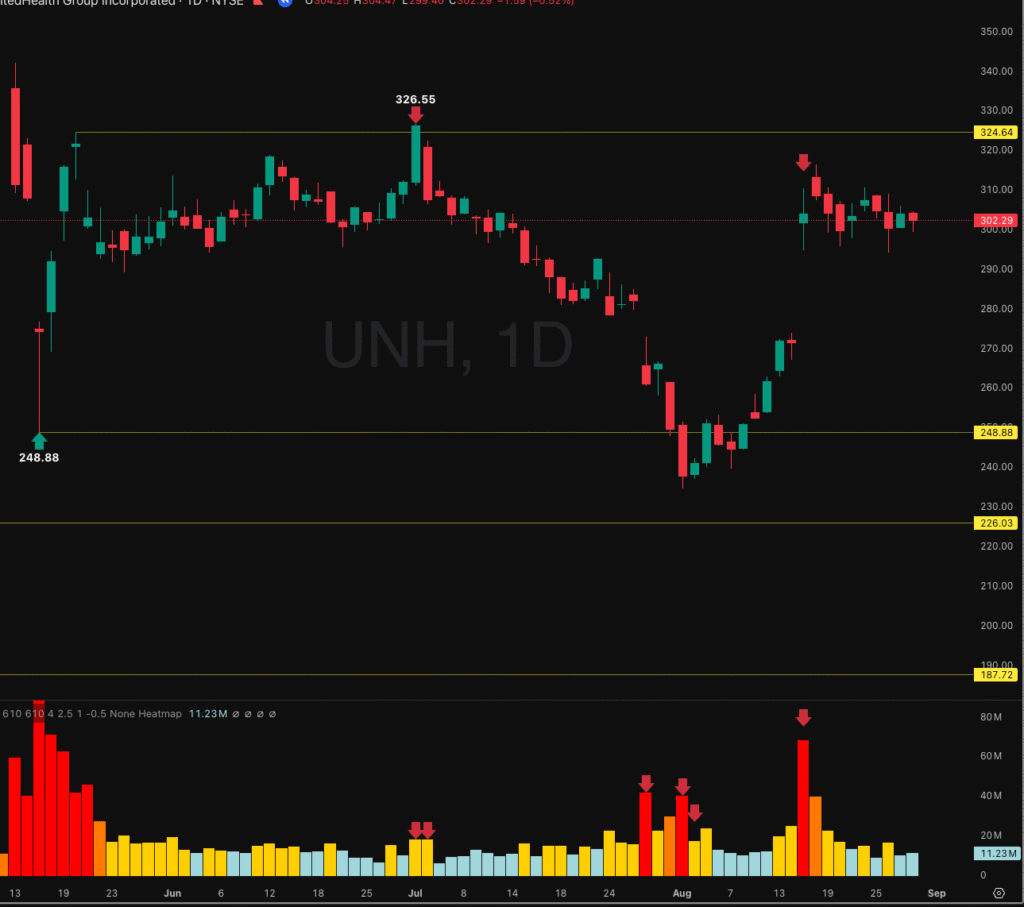
On the next session, August 4th, 2025, the stock recovered a little, but volume dropped off sharply. That was a good sign—it showed the selling pressure was already fading. Over the next couple of days, the price slowly climbed back up toward our entry price around $248.88.
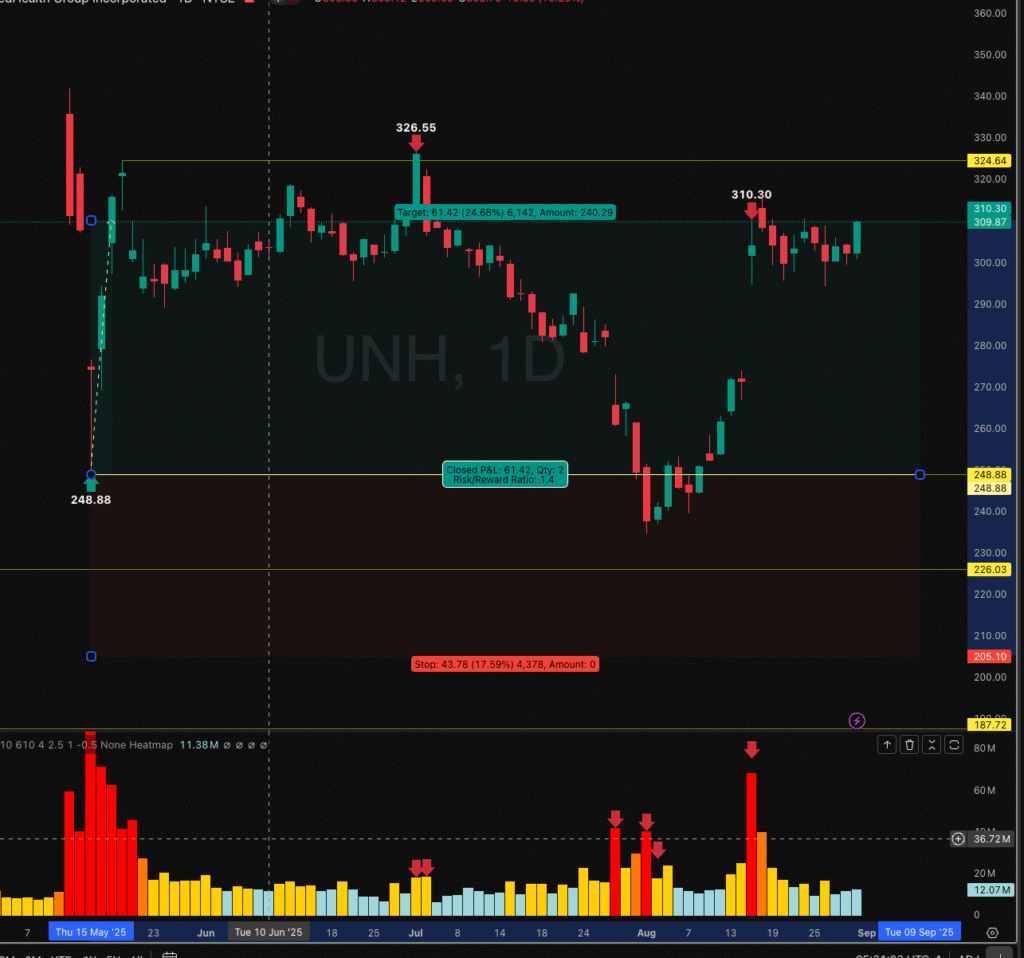
Once the sellers backed off, buyers stepped in and quickly pushed the stock up to around $310.30. But on Friday, August 15th, 2025, the stock rocketed 12% in a single day and closed with a top-wick candle and a huge volume spike, right near a pivot level. That met all 3 rules of my setup, but this time it was showing the opposite side—buyers were taking profits and closing out their positions.
For me, that was the signal to exit. I closed my trade after the market ended. The stock didn’t reach my full target, but I have to respect my system. Sometimes the market doesn’t follow the plan exactly, and that’s okay. This was still a very profitable trade in a short period of time, and the key is staying disciplined.
Closing Thoughts
This $UNH trade is a perfect reminder of why I stick to the 3-Rules Setup: volume, wick, and pivot. The entry at $248.88 gave me a clean opportunity, and even though the trade didn’t hit the full target, respecting my rules kept it profitable and safe.
The lesson is simple—discipline matters more than prediction. Not every trade will play out exactly as planned, but by following a clear process, you give yourself an edge over time.
Patience, risk management, and respecting the system will always separate a consistent trader from someone just chasing moves.
Trade safe, stay patient, and let the market come to you.
Tools I Personally Use for Charting
I do all my charting and trade analysis on TradingView. If you want to try it out, here’s my affiliate link:
TradingView
Disclosure: This is an affiliate link. If you sign up through it, I may earn a small commission at no extra cost to you. I only recommend tools I personally use and trust.