The Simplest Trading Strategy for Beginners: The 3 Rules Setup (1)
Hi, today I want to share my trading system, which I guarantee is the simplest and most repeatable approach you’ll encounter. Simplicity is essential in trading. If you’ve spent time online, you’ve likely seen overly complicated strategies filled with overcomplicated and unnecessary components. In my experience, the more complex a system, the less effective it becomes. Trading is definitely not easy but not inherently complicated: you buy low and sell high. The challenge is knowing when. My three rules setup addresses exactly that. No fancy indicators with a bunch of drawings — just three clear checks you can use on any chart or timeframe.
The 3 Rules Trading Setup Explained
The system revolves around three key rules to evaluate potential trades:
- Volume: Specifically, a unusual high volume inflow as price action climbs into supply or falls into demand. This volume can confirm either an impending reversal or a continuation through a price zone.
- A wick: Look for a wick on the price action. For instance, if price is falling into demand, I expect a strong bottom wick indicating buyer presence. Conversely, for a rejection off supply after an uptrend, I look for a top wick showing seller involvement. Combining wicks with volume provides significant confidence in the price direction.
- Pivots: The closer you are to a historical high-volume support or resistance levels, the more likely price will react, boosting your trade confidence.
I know this might sound like a lot at first, so let’s dive into some real examples to make it clearer.
Example 1: NASDAQ Trade on the 30-Minute Chart (Aug 29, 2025)
Trade Setup: Identifying the Levels
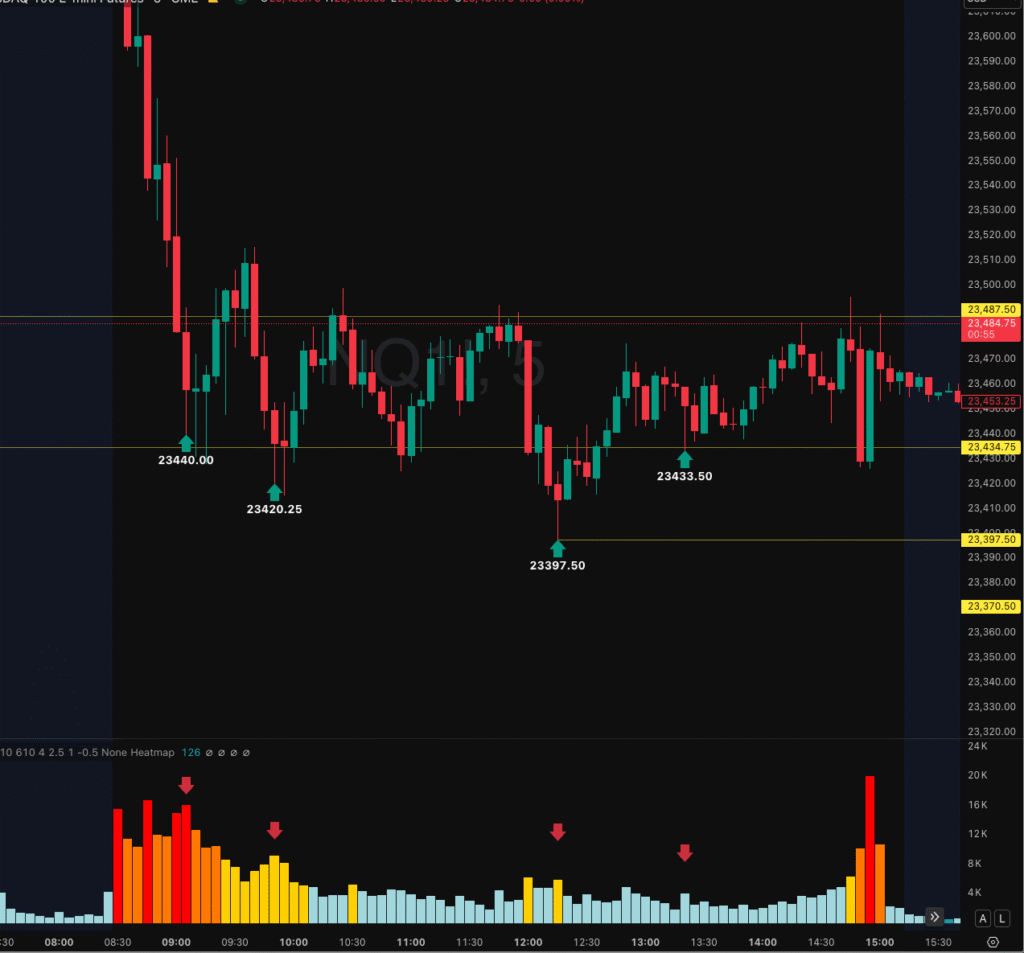
On August 29th, 2025, NASDAQ on the 30-minute chart moved quickly lower early in the session, heading into two pivot points at 23,487 and 23,434. I was watching for a potential trade to the upside.
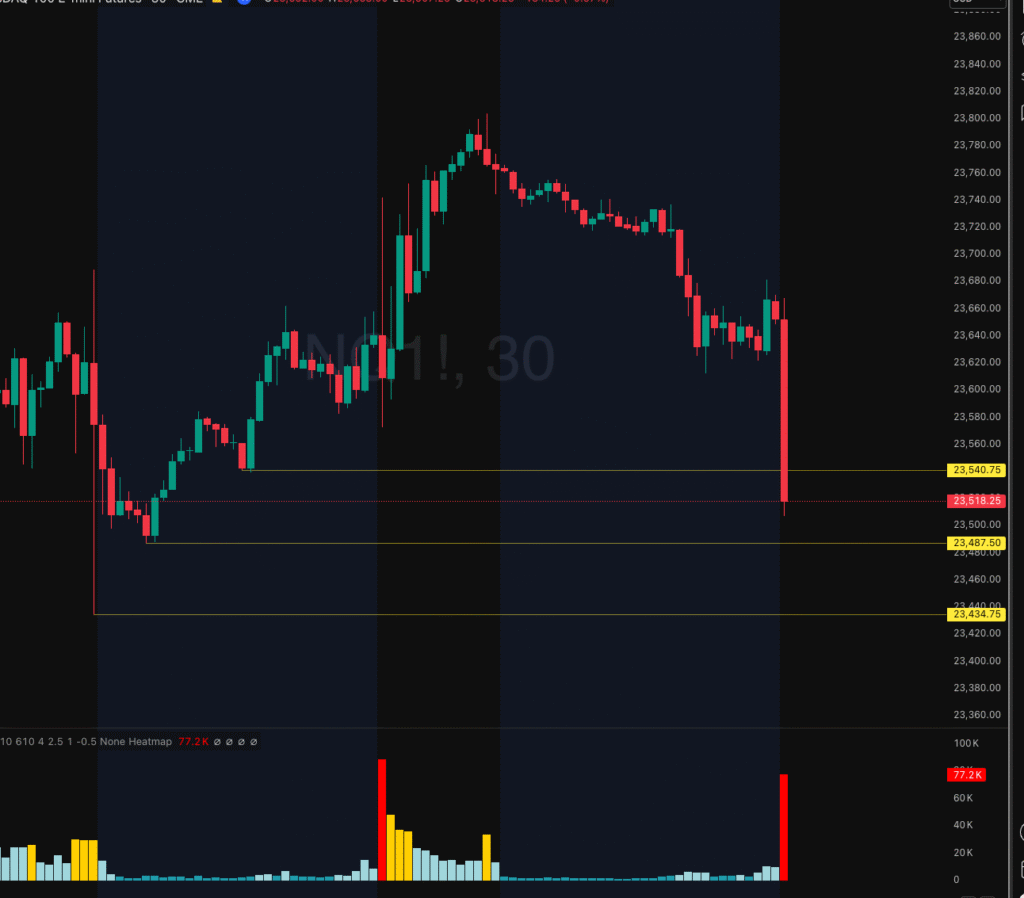
Figure 1: NASDAQ 30-min chart with pivot levels 23487 and 23434
First Test: Why I Passed on 23,487
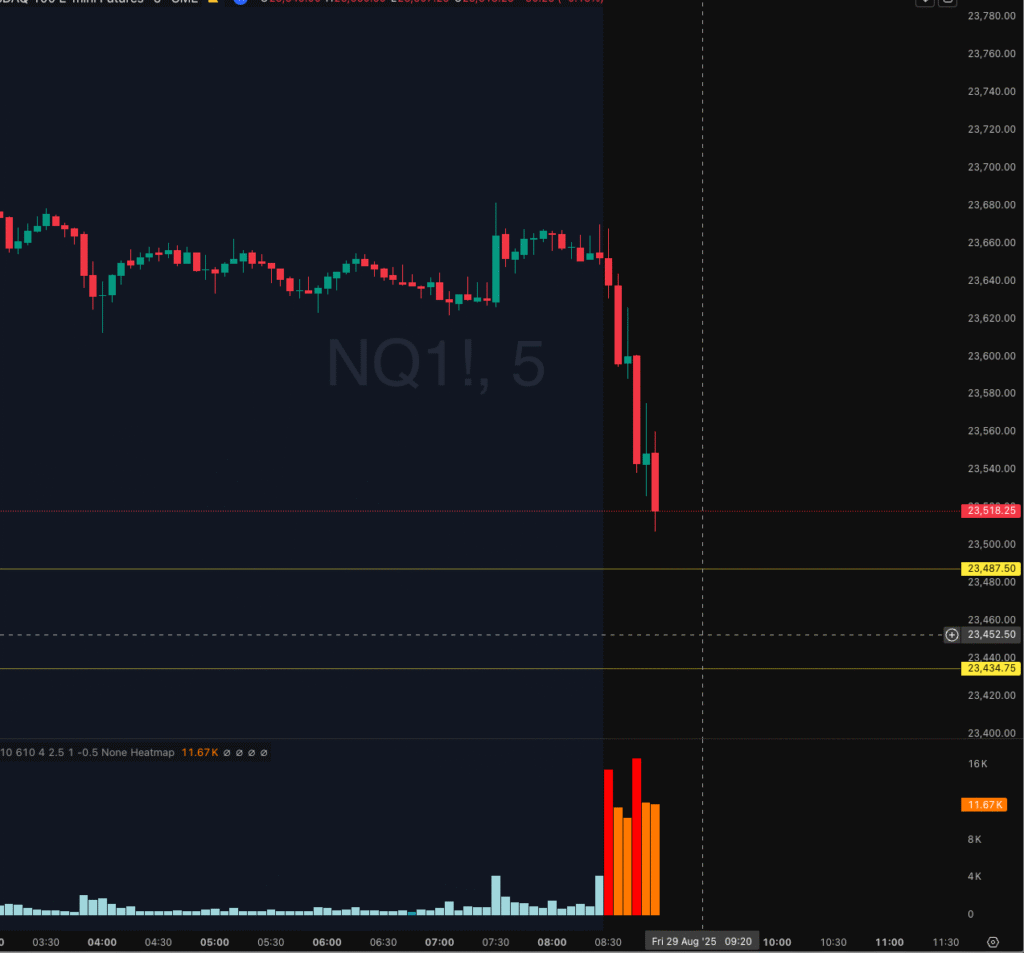
At 8:55 EST on the 5-minute chart, price approached the first support level at 23,487.
- The candle closed with a bottom wick, showing some buying interest.
- But volume was much lower than previous candles.
Since my most important rule is high volume confirmation, this setup did not qualify—so I stayed out.
Second Test: Entry Trigger at 23,440
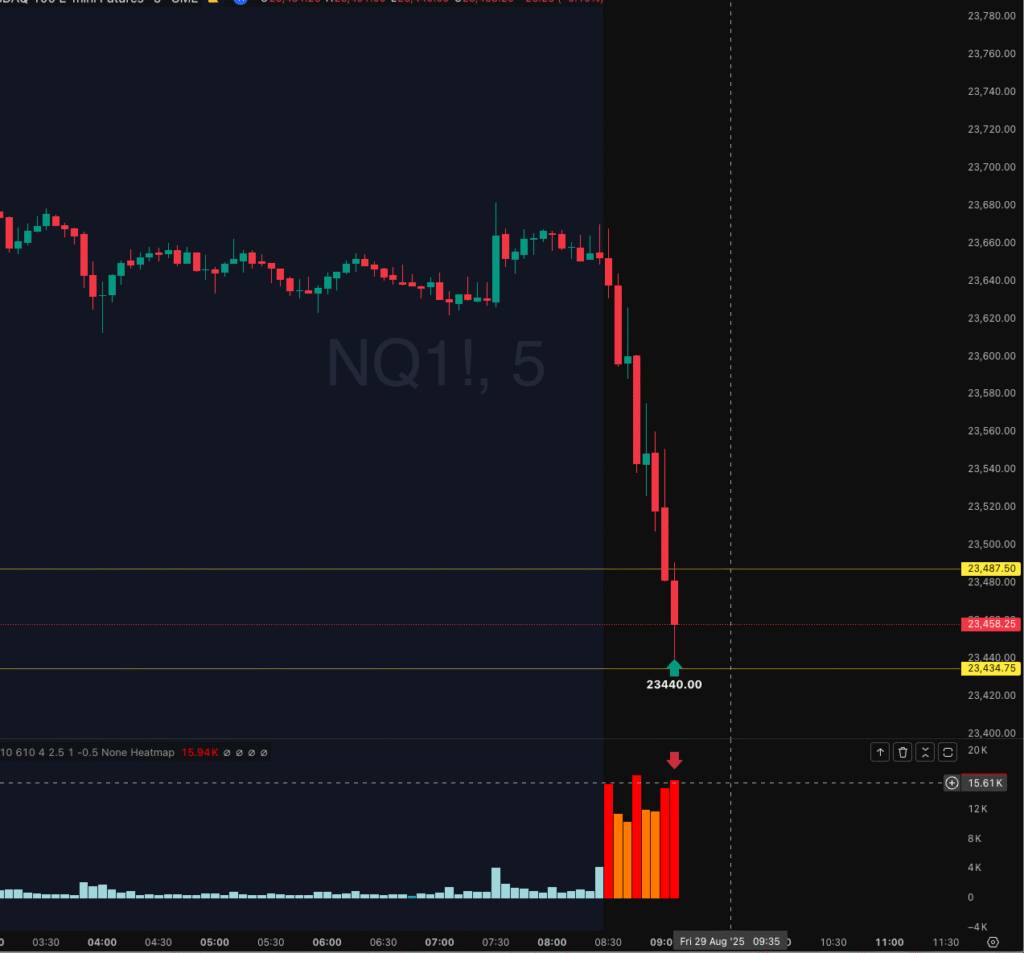
At 9:05 EST, price broke below 23,487 and tested the next pivot at 23,434. This time:
- A strong bottom wick formed.
- High volume appeared, much higher than surrounding candles.
- The candle closed at 23,440, right near the pivot level.
This met all three of my rules (volume, wick, close above pivot), so I entered long with a limit order at 23,440. My profit target was set at the last broken level: 23,487.
The Result: How I Captured 47 Points
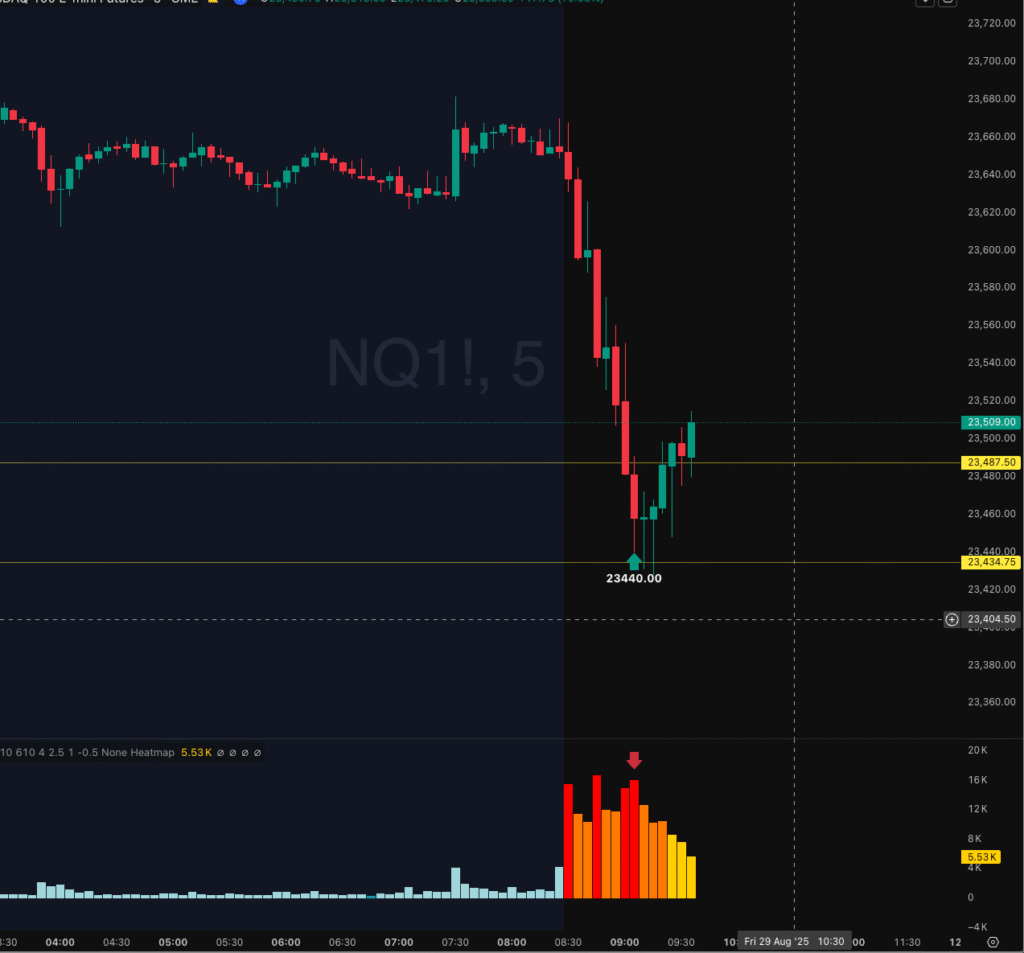
For the next 15 minutes, price repeatedly tested the 23,434–23,440 area. Buyers defended the level time, and eventually price pushed back up to 23,487, hitting my target.
➡️ That’s a 47-point trade—a fantastic, high-probability setup.
For the rest of the session, we could see more potential trades that met our rules here. As the price moves below the pivot level at 23,434 buyers keep defending the level and pushed it back up. Every time, the volume rises up significantly.
Key Lesson: Volume is Everything
The most important thing I look at is volume. It’s very hard to hide, even in a manipulated market.
Almost every time the market pivots (changes direction), you’ll see a volume spike:
- At the top → sellers step in after a strong rally.
- At the bottom → buyers step in after a sharp selloff.
So when I see a sudden burst of volume at support or resistance, it tells me the other side of the market is here. That’s when I pause, reassess, and prepare for a trade.
Final Note: Keep Trading Simple and Patient
Keep it simple—watch volume, respect pivots, and wait for clean setups. Consistency comes from patience, not chasing every move. Trade safe and let the market come to you.
Tools I Personally Use for Charting
I do all my charting and trade analysis on TradingView. If you want to try it out, here’s my affiliate link:
TradingView
Disclosure: This is an affiliate link. If you sign up through it, I may earn a small commission at no extra cost to you. I only recommend tools I personally use and trust.